I. Overview
The ecological footprint is a method promoted by the Global Footprint Network to measure human demand on natural capital, i.e. the quantity of nature it takes to support people and their economies. It tracks this demand through an ecological accounting system. The accounts contrast the biologically productive area people use for their consumption to the biologically productive area available within a region, nation, or the world (biocapacity, the productive area that can regenerate what people demand from nature). In short, it measures human impact on the environment and whether that impact is sustainable.
Footprint and biocapacity can be compared at the individual, regional, national, or global scale. Both footprint and demands on biocapacity change every year with the number of people, per person consumption, efficiency of production, and productivity of ecosystems. At a global scale, footprint assessments show how big humanity’s demand is compared to what Earth can renew. Global Footprint Network estimates that, as of 2019, humanity has been using natural capital 75% faster than Earth can renew it, which they describe as meaning humanity’s ecological footprint corresponds to 1.75 planet Earths. This overuse is called ecological overshoot.
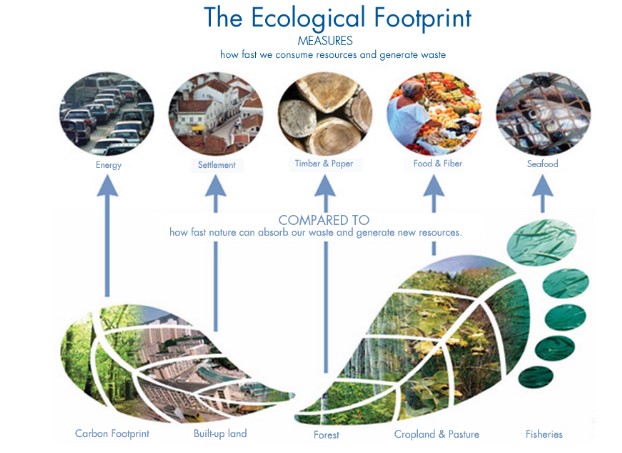
Image source: https://www.footprintnetwork.org/our-work/ecological-footprint/
II. Ecological Footprint Method
The Footprint method identifies two parts: ecological reserves (area for biological productivity) and human needs. Accordingly, ecological reserves are calculated for six types of areas:
– Cropland: is the area used for farming to collect food, animal feed, and cotton fiber, including 70 types of primary area and 15 types of secondary area.
– Grazing land: is an area used to raise animals for meat, leather, wool, and milk, including natural and semi-natural pastures.
– Forest: includes natural forests and planted forests to collect fuel wood and round wood.
– Aquatic water surface: is the area providing freshwater and seawater aquatic products, including 8 types of fish, aquatic animals, and 1 type of aquatic plant.
Construction land: the area used to build infrastructure: houses, industrial parks, power plants,…
– Energy land or “carbon land”: is the area of land or ocean needed to absorb CO2 emissions from fossil fuel combustion.
The ecological footprint is calculated for more than 150 countries around the world, in which, each country’s consumption is calculated by the amount of produced products plus (+) the number of imported products, then minus (–) the quantity of exported products. A country will have “ecological reserves” if its Ecological Footprint is smaller than its Biological Carrying Capacity, otherwise, it will be in a state of “ecological deficit”. Currently, most countries are in a state of ecological deficit.
In Vietnam, data for calculating Ecological Footprint and Ecological Carrying Capacity are available in the annual reports of the National Footprint Network and WWF. The change in Vietnam’s ecological footprint and biological capacity follows the global trend, with the ecological footprint gradually increasing. Although compared to the world, Vietnam’s ecological footprint is still at a level that is not worrying, Vietnam’s demand for resources is greater than nature’s carrying capacity.
III. Result evaluation
Ecological footprints just document the resource dependence of cities on rural hinterlands. Critics argue that this is a dubious characterization, since farmers in developed nations may easily consume more resources than urban inhabitants, due to transportation requirements and the unavailability of economies of scale. Furthermore, such moral conclusions seem to be an argument for autarky. But this is similar to blaming a scale for the user’s dietary choices. Even if true, such criticisms do not negate the value of measuring different cities’, regions’, or nations’ ecological footprints and comparing them. Such assessments can provide helpful insights into the success or failure of different environmental policies.
Since this metric tracks biocapacity, the replacement of original ecosystems with high-productivity agricultural monocultures can lead to attributing a higher biocapacity to such regions. For example, replacing ancient woodlands or tropical forests with monoculture forests or plantations may decrease the ecological footprint. Similarly, if organic farming yields were lower than those of conventional methods, this could result in the former being “penalized” with a larger ecological footprint. Complementary biodiversity indicators attempt to address this. The WWF’s Living Planet Report combines the footprint calculations with the Living Planet Index of biodiversity.)
Environmentalists have used ecological footprint for many years as a way to quantify ecological degradation as it relates to an individual.
[REFERENCES]
- Many authors. Ecological Footprints. 2022. From: https://en.wikipedia.org/wiki/Ecological_footprint
- Many authors. Things to know about the concept of Ecological Footprint. 2023. Vietnam Peace and Development Foundation.From: http://vpdf.org.vn/tin-tuc-su-kien/moi-truong-sinh-thai/nhung-dieu-can-biet-ve-khai-niem-da-u-chan-sinh-tha-i.html

 Tiếng Việt
 日本語
日本語